Scheme of research stages
Fig. 1. Scheme of the second research stage
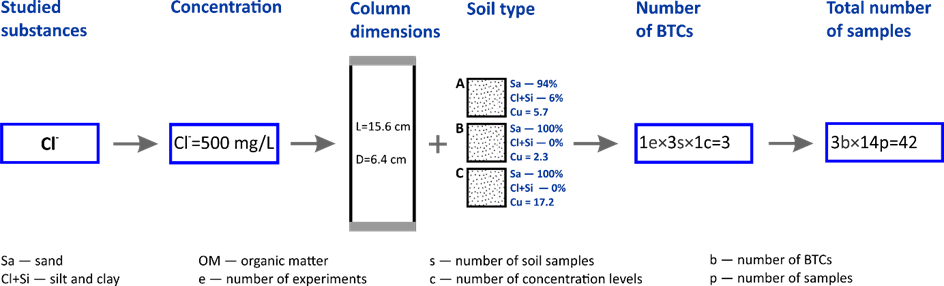
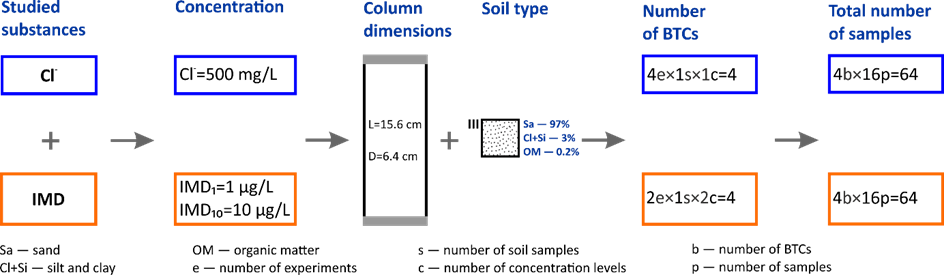
Fig. 2. Scheme of the third research stage
………….
Detailed characteristic of research stages
Table 1. Characteristics of the conditions of column experiments for the second stage
| Parameters | Soils | ||
| A | B | C | |
| Volume of water taken [mL] | 750 | 700 | 700 |
| Time of experiment [min] | 221 | 198 | 208 |
| Average flow [mL/min] | 3.47 | 3.54 | 3.46 |
| Water filtration velocity [cm/min] | 0.108 | 0.110 | 0.107 |
| Tracer volume [mL] | 300 | 300 | 300 |
| Chloride concentration [mg/L] | 500 | 500 | 500 |
Table 2. Characteristics of the conditions of column experiments for the third stage
| Parameters | Soil S-III |
| Pump capacity [mL/min] | 0.6 |
| Water filtration velocity [cm/min]1) | 0.019 |
| Pore-water velocity [cm/min]1) | 0.077 |
| Duration of injection [min] | 667 |
| Total experiment time [min] | 1125 |
| Tracer volume [mL] | 400 |
| Chloride concentration [mg/L]2) | 509/506 500/5013) |
| Imidacloprid concentration [µg/L]2) | 0.858/0.771 8.85/7.883) |
1) Parameters calculated on the basis of specific formulas,
2) Concentrations in the injected solution,
3) The reported values correspond to two concentration levels for duplicate column experiments.
Soil characteristics
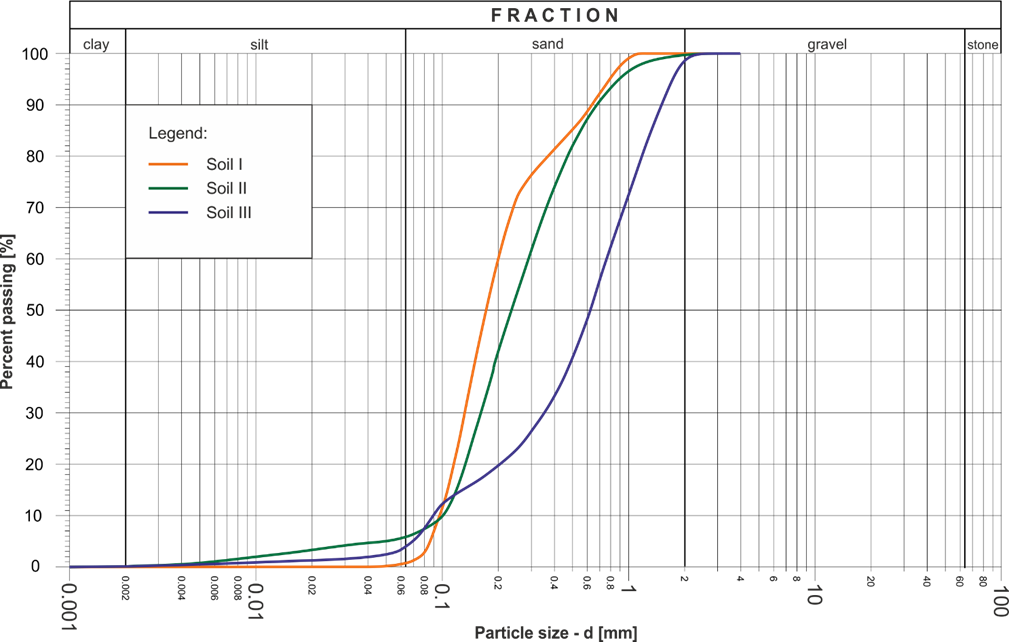
Fig. 3. Particle size distribution of the investigated soils: a) stage 2; b) stage 3
a)
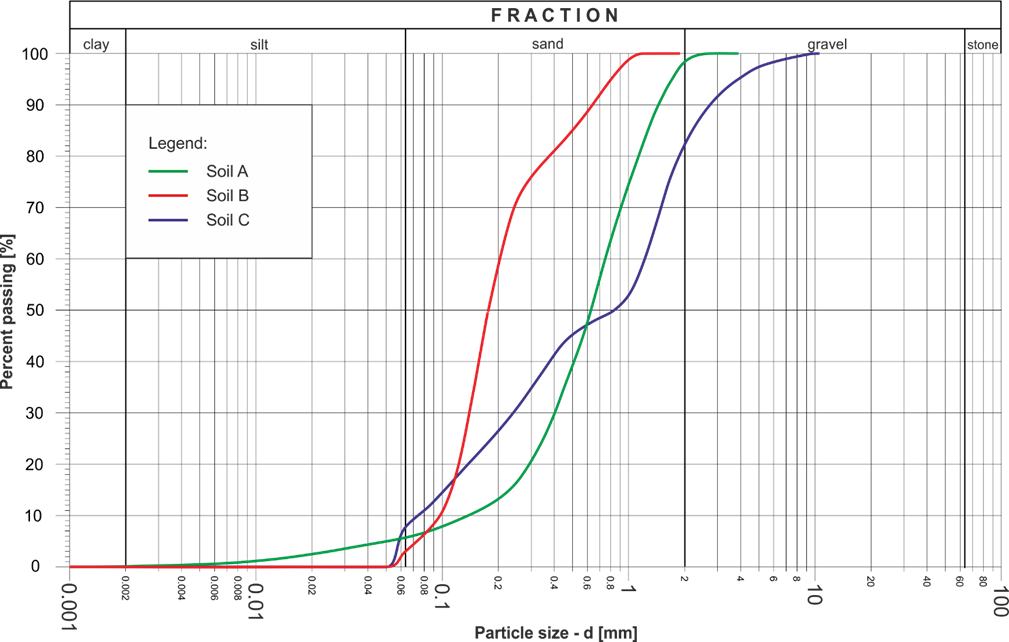
b)