MEASUREMENT OF ROAD TRAFFIC PARAMETERS USING AN INDUCTIVE SINGLE-LOOP DETECTOR
Janusz Gajda, Ryszard Sroka, Marek Stencel, Tadeusz Żegleń
University of Mining & Metallurgy, Departement of Instrumentation and Measurement, POLAND
e_mail: jgajda@uci.agh.edu.pl
ABSTRACT
The paper presents a system for the counting vehicles and measuring their velocity and length, based on a single inductive loop placed under the road surface. Results of experimental and simulation studies of the system are also presented, along with the algorithm for processing measurement signals.
1. INTRODUCTION
This study addresses problems linked with the measurement of road traffic parameters and using inductive loops placed under the road surface. The basic measured parameters are the number of travelling vehicles, their velocities and lengths. The advantage of applying inductive loops, as compared to other technical applications (such as video cameras) is the low cost of the measurement system. One of the major components of this cost is the installation of the loop in existing roads. Replacement of the traditional two-loop system by a single-loop layout requires development of an algorithm capable of suficient determination of the velocity and length of the vehicle, based on a time-variable signal from one sensor. The paper presents results of experimental and simulation investigation of such an algorithm.
2. ROAD TRAFFIC PARAMETER MEASURING SYSTEM
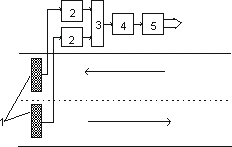
A diagram of the proposed measurement system is shown in Figure 1.
Fig. 1. Diagram of the road traffic parameter measurement system. 1 - inductive loop, 2 - signal conditioning circuits, 3 - multiplexer, 4 - a/d converter, 5 - microcomputer.
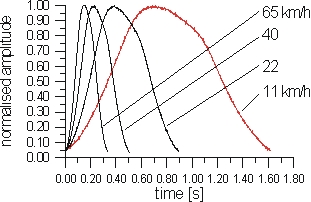
Fig. 2. Amplitude-normalised time waveforms of the signals generated by a car moving at different speeds.
The system can simultaneously cooperate with one or several loops placed under different road lanes. The factor that significantly limits the number of available measurement channels is the computer calculation rate. Results of velocity and vehicle length measurements are stored in the computer's memory along with additional information on the time of the event. This information allows long-term reports illustrating the time-dependent variations in traffic intensity and vehicle types (classification according to the length) to be generated. Measurement results are also shown on a special display.
The key element of the described measurement system is the data processing algorithm. The algorithm developed by the authors is based on parameters of a time-variable signal generated in the measurement circuit by a vehicle. These parameters vary with the changing velocity of the vehicle, and their variability can be experimentally determined. The experiments performed (several dozen recorded signals generated by various types of vehicles, moving at speeds ranging from 10 to 70 km/h) indicated that these variations are linear and do not depend on the type of vehicle. Examples of signal waveforms generated by a car moving at different speeds are shown in Figure 2.
To decrease sensitivity of the measurement results to interference comprised in the signals analyzed, the algorithm operates based on activated signals smoothed by polynomial approximation. The number of signal samples taken into account by this approximation and the degree of the polynomial are the basic parameters affecting correct functioning of the algorithm.
3. EXPERIMENTAL RESEARCH
The experiments performed were intended to determine velocity measurement errors arising from the proposed measurement system layout. The measurement error was determined by comparing the results with the results obtained by a system using two loop sensors placed 10 meters from each other. Measurement results from this second system were initially verified using the radar method. The divergence of measurement results did not exceed 2 km/h.
It is worth mentioning that both systems measure two different parameters. The single-sensor system measures the instantaneous velocity of a vehicle at the location of the sensor. The system with two loops measures the average velocity of the vehicle over a distance of 10 meters. Changing vehicle velocity may cause an apparent increase in the measurement system error.
The static characteristic of the investigated system and the variability of the velocity measurement errors recorded for various types of cars are shown in Figure 3.
In the experiments performed, the relative velocity measurement error did not exceed 10%, which, after conversion to absolute units, means a maximum velocity measurement error of 3.5 km/h (within the range of 10-70 km/h). It should be mentioned that the driver involved in the experiment knew about the measurement being taken and tried to maintain a constant speed.
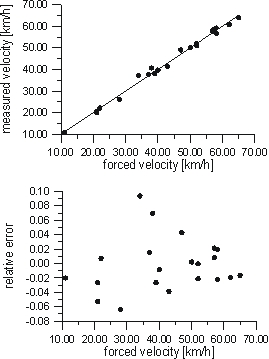
Fig. 3a Static characteristic and variability of velocity measurement errors in the proposed system (car type: LADA 2107)
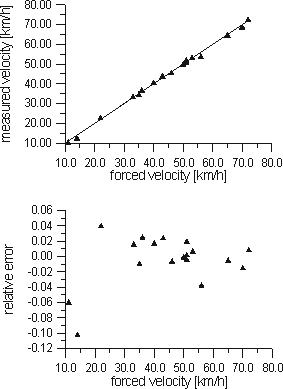
Fig. 3b. Static characteristic and variability of velocity measurement errors in the proposed system (car type: FIAT UNO 1.4)
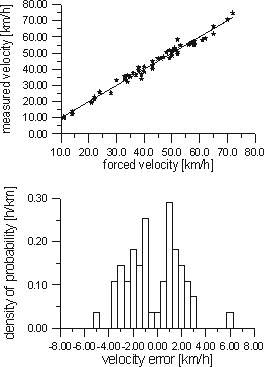
Fig. 4. Results of velocity measurements and the density of measurement error probability.
When the vehicles involved in the experiments were random (different speeds and different types), the maximum error was 6.4 km/h, and the RMS-error (more reliable in this case) was 2.13 km/h. Figure 4 shows the distribution of velocity measurement results around the ideal static characteristic and the density of the measurement error distribution probability. These characteristics have been determined based on 55 measurements of car and municipal bus velocities.
4. SIMULATION STUDIES
The objective of the performed study was to determine the influence of interference by selected parameters of the measurement circuit and data processing algorithm on velocity measurement errors arising from the use of the single-loop circuit.
Figure
5 shows the influence of the relative standard deviation of
additive random interferences (normal distribution ![]() ) comprised in the
measurement signal, on the velocity determination error.
) comprised in the
measurement signal, on the velocity determination error.
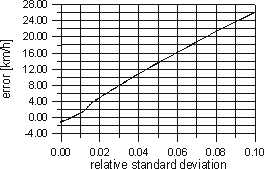
Fig. 5. Influence of additive interference on the velocity measurement error.
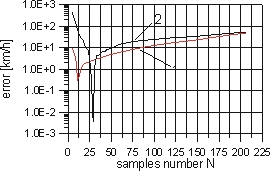
Fig. 6a. Effects of the number of measurement signal samples taken into account in building a smoothing polynomial. 1 - no interference, 2 - in the presence of additive random interference (normal distribution, standard deviation equal to 10% of the signal amplitude).
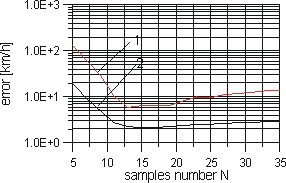
Fig. 6b. Effects of the number of measurement signal samples taken into account in building a smoothing polynomial (various types of vehicles, no interference), 1 - maximum error, 2 - RMS- error.
In the proposed measurement system, the relative level of interference does not exceed the value of 0.01. Thus the error arising from this coefficient should remain within the range of ±2 km/h.
The impact of this type of interference may be significantly limited by an appropriate selection of the number of measurement signal samples used to built the smoothing polynomial (width of the rectangular time-window). The impacts of this parameter, associated with determined car type, are shown in Figure 6a. The impacts of this parameter, determined for various types of vehicles (all the results gathered during the experiment) are shown in Figure 6b.
Besides external factors, such as, for example the non-stationary character of the vehicle's velocity or interference, the algorithm of digital measurement signal processing may itself be an additional source of measurement error. Figure 7 illustrates the relationship between algorithm errors (at determined values of parameters) and the vehicle velocity. These errors are higher in the case of lower velocities, thus not exceeding the value of -1.5 km/h.
As previously mentioned, one of the reasons for the divergence between the velocity measurement results from one- and two-loop circuits is the non-stationary character of the vehicle's velocity. The influence of this factor on the apparent increase of the measurement error is illustrated in Figure 8. The characteristics presented have been determined based on the assumption that the vehicles move with uniformly accelerated motion with various initial speeds and various accelerations.
It is obvious that this effect will be more noticeable in the case of low velocities. It may cause divergences between indications from the two systems reaching as much as a few kilometers per hour.
The above mentioned basic factors affecting vehicle length measurement (length measurement results are closely linked with velocity determination) are complemented by the dynamic features of the
measurement circuit interfering with the measurement signals. Figure 9 shows the influence of vehicle velocity
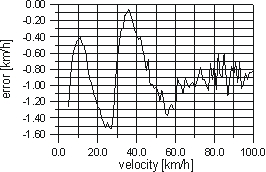
Fig. 7. Influence of the vehicle's velocity on the measurement data algorithm errors.
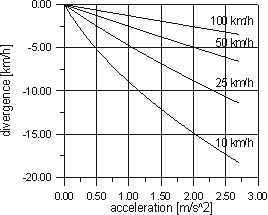
Fig. 8. Influence of vehicle acceleration on divergence between the measurement results from one- and two-loop circuits (for different initial velocities of the vehicle).
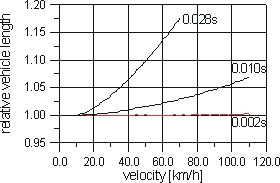
Fig. 9. Effects of vehicle velocity on length determination ( for various dynamic characteristics of the measurement circuit characterized by a time-constant).
on the results of length determination. The characteristics presented were determined based on the assumption that dynamic features of the measurement circuit can be described by a first order inertial system with different values of time-constant.
5. SUMMARY
The experiments performed and simulation studies indicate that the proposed equipment and software fulfill the requirement of equipment simplification (cost reduction) and, on the other hand, allow a satisfactory level of measurement accuracy to be maintained. The RMS-error of velocity measurement (within a broad range of speeds and types of vehicles) did not exceed 2.5 km/h.
ACKNOWLEDGEMENT
This work was supported by Polish Comittee of Scientific Reseaech (grant No 8 T10C 01411).