In [1]:
format compact % zmiana sposobu wyświetlania wyników w MATLAB(bez zbędnych pustych linii)
Aproksymacja - plan dwupoziomowy
Belka jednostronnie utwierdzona
Dana jest belka o długości \(L\) z materiału o module Younga \(E\) posiadająca przekrój prostokątny o momencie bezwładności \(I\) (wyznaczonym na podstawie jego szerokości \(w\) i wysokości \(h\)). Równanie różniczkowe opisujące ugięcie belki utwierdzonej na jedmym końcu (dla \(x=L\)) z obciążeniem ciągłym \(Q\) ma postać
\[\mathrm{EI}\,\frac{\partial ^4}{\partial x^4} y\left(x\right)=Q\]
Przemieszczenia maksymalne w belce występują na jej swobodnym końcu i wynoszą
\[\delta_{max} (w,h) =\frac{3\,L^4\,Q}{2 E\,h^3\,w}\]
Naprężenia maksymalne w belce występują na jej utwierdzonym końcu i wynoszą
\[\sigma_{max} (w,h) =\frac{3\,L^2\,Q}{h^2\,w}\]
Zakładając, że \(L=1\) m, \(E=2 \cdot 10^{11}\) Pa, \(Q= 10^{5}\) N, oraz że \(w\) i \(h\) zawierają się w przedziale \([0.1, 0.2]\) m
Zapis pliku funkcyjnego opisującego model
In [2]:
%%file model_belki.m
function [delta_max sigma_max]=model_belki(w, h)
L=1;Q=1e5;E=1e11;
delta_max= (3*L^4*Q)/(2*E*h^3*w);
sigma_max = (3*L^2*Q)/(h^2*w);
Created file 'D:\Wprowadzenie_do_MATLAB\model_belki.m'.
In [3]:
[d s]=model_belki(0.1, 0.1)
d =
    0.0150
s =
   3.0000e+08
Eksperyment dwupoziomowy
In [4]:
clear all
x_lim=[.1 .2
       .1 .2]
x_lim =
    0.1000    0.2000
    0.1000    0.2000
In [5]:
dFF2 = ff2n(2)
dFF2 =
     0     0
     0     1
     1     0
     1     1
In [6]:
%przeskalowanie planu do przedziału [-1,1]
x=dFF2*2-1
x =
    -1    -1
    -1     1
     1    -1
     1     1
In [7]:
Experiment=zeros(size(x));
Experiment(x(:,1)==-1,1)=x_lim(1,1);
Experiment(x(:,1)==1,1)=x_lim(1,2);
Experiment(x(:,2)==-1,2)=x_lim(2,1);
Experiment(x(:,2)==1,2)=x_lim(2,2);
Experiment
Experiment =
    0.1000    0.1000
    0.1000    0.2000
    0.2000    0.1000
    0.2000    0.2000
In [8]:
for k=1:length(x(:,1))
[d s]=model_belki(Experiment(k,1), Experiment(k,2));
y(k,1)=d;
end
y
y =
    0.0150
    0.0019
    0.0075
    0.0009
In [9]:
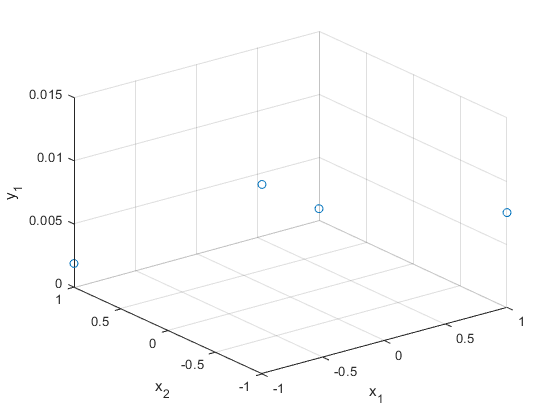
plot3(x(:,1),x(:,2),y(:,1),'o')
xlabel('x_1'), ylabel('x_2'), zlabel('y_1')
grid on
In [10]:
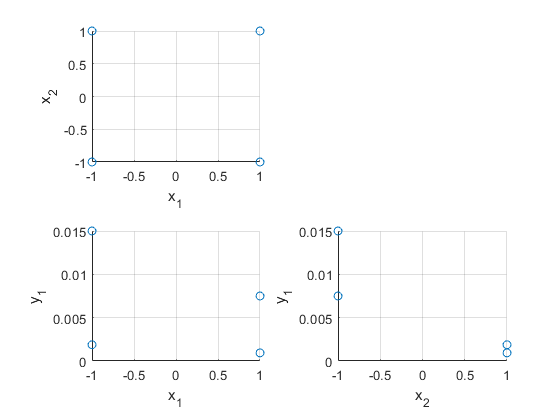
figure
subplot(2,2,1)
plot3(x(:,1),x(:,2),y(:,1),'o'), xlabel('x_1'), ylabel('x_2'), zlabel('y_1'), grid on, view(0,90)
subplot(2,2,3)
plot3(x(:,1),x(:,2),y(:,1),'o'), xlabel('x_1'), ylabel('x_2'), zlabel('y_1'), grid on, view(0,0)
subplot(2,2,4)
plot3(x(:,1),x(:,2),y(:,1),'o'), xlabel('x_1'), ylabel('x_2'), zlabel('y_1'), grid on, view(90,0)
Aproksymacja punktów powierzchnią odpowiedzi
In [11]:
%Założenie postaci funkcji
%f1(x1,x2) = a00+a10*x1+a01*x2

X=[ones(length(x(:,1)),1) x(:,1) x(:,2)]

Y=y(:,1)
%XA=Y
A=X\Y

a00=A(1);a10=A(2);a01=A(3);
f1=@(x1,x2) a00+a10*x1+a01*x2
[X1,X2]=meshgrid([-1:0.1:1]);
Y1=f1(X1,X2);
X =
     1    -1    -1
     1    -1     1
     1     1    -1
     1     1     1
Y =
    0.0150
    0.0019
    0.0075
    0.0009
A =
    0.0063
   -0.0021
   -0.0049
f1 =
  function_handle with value:
    @(x1,x2)a00+a10*x1+a01*x2
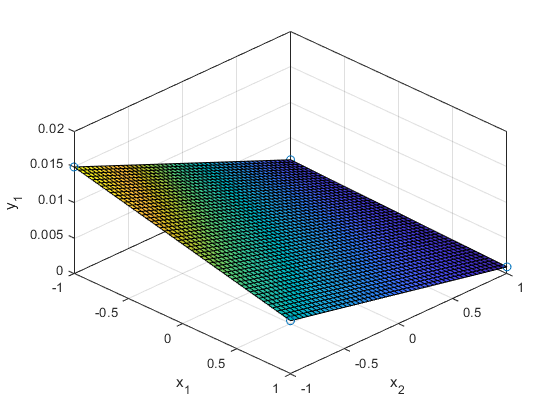
In [12]:
surf(X1,X2,Y1)
hold on
plot3(x(:,1),x(:,2),y(:,1),'o')
xlabel('x_1'), ylabel('x_2'), zlabel('y_1')
view(45,45)
grid on
In [13]:
%syms x1 x2        % alternatywny sposób narysowania wykresu
%f2=a00 + a10*x1 + a01*x2 + a11*x1*x2
%fsurf(f2,[-1 1])
%hold on
%plot3(x(:,1),x(:,2),y(:,1),'o')
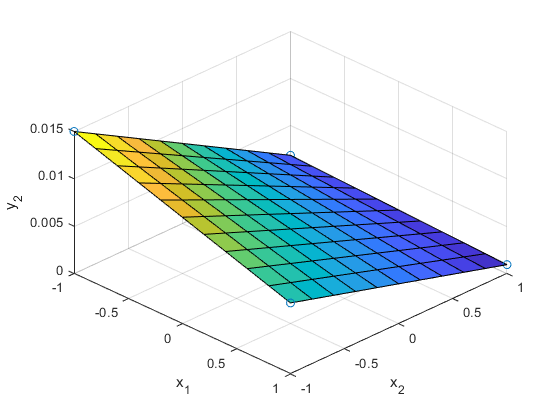
Zmiana postaci funkcji opisującej powierzchnię
In [14]:
%Założenie postaci funkcji
%f2(x1,x2) = a00+a10*x1+a01*x2+a11*x1*x2

X=[ones(length(x(:,1)),1) x(:,1) x(:,2) x(:,1).*x(:,2)]

Y=y(:,1)
%XA=Y
A=X\Y

a00=A(1);a10=A(2);a01=A(3);a11=A(4);

f2=@(x1,x2) a00 + a10*x1 + a01*x2 + a11*x1.*x2
[X1,X2]=meshgrid([-1:.2:1]);
Y2=f2(X1,X2);
X =
     1    -1    -1     1
     1    -1     1    -1
     1     1    -1    -1
     1     1     1     1
Y =
    0.0150
    0.0019
    0.0075
    0.0009
A =
    0.0063
   -0.0021
   -0.0049
    0.0016
f2 =
  function_handle with value:
    @(x1,x2)a00+a10*x1+a01*x2+a11*x1.*x2
In [15]:
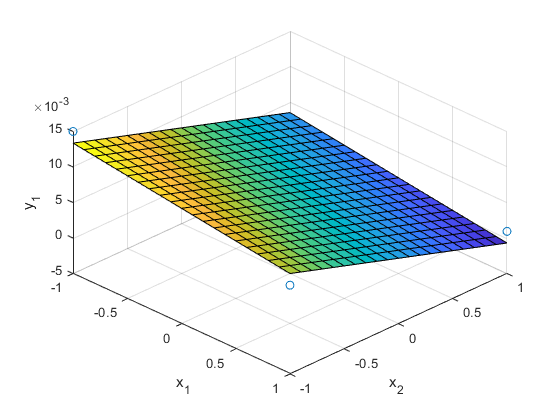
surf(X1,X2,Y2)
hold on
plot3(x(:,1),x(:,2),y(:,1),'o')
xlabel('x_1'), ylabel('x_2'), zlabel('y_2')
view(45,45)
grid on
Aproksymacja w sposób „pół-automatyczny” przy pomocy cftool (Curve Fitting Toolbox)
In [16]:
help cftool
  CFTOOL   Open Curve Fitting Tool.

    CFTOOL opens Curve Fitting Tool or brings focus to the Tool if it is already
    open.

    CFTOOL( X, Y ) creates a curve fit to X input and Y output. X and Y must be
    numeric, have two or more elements, and have the same number of elements.
    CFTOOL opens Curve Fitting Tool if necessary.

    CFTOOL( X, Y, Z ) creates a surface fit to X and Y inputs and Z output. X, Y,
    and Z must be numeric, have two or more elements, and have compatible sizes.
    Sizes are compatible if X, Y, and Z all have the same number of elements or X
    and Y are vectors, Z is a 2D matrix, length(X) = n, and length(Y) = m where
    [m,n] = size(Z). CFTOOL opens Curve Fitting Tool if necessary.

    CFTOOL( X, Y, [], W ) creates a curve fit with weights W. W must be numeric
    and have the same number of elements as X and Y.

    CFTOOL( X, Y, Z, W ) creates a surface fit with weights W. W must be numeric
    and have the same number of elements as Z.

    CFTOOL( FILENAME ) loads the surface fitting session in FILENAME into Curve
    Fitting Tool. The FILENAME should have the extension '.sfit'.

    Reference page in Doc Center
       doc cftool
In [17]:
x1=x(:,1); x2=x(:,2); y1=y(:,1); cftool(x1,x2,y1);
In [18]:
ft = fittype( 'a00 + a10*x1 + a01*x2 +a11*x1*x2', 'independent', {'x1', 'x2'}, 'dependent', 'y' );
opts = fitoptions( 'Method', 'NonlinearLeastSquares' );
opts.Algorithm = 'Levenberg-Marquardt';

sf = fit( x, y(:,1), ft, opts)

plot3(x(:,1),x(:,2),y(:,1),'o')
xlabel('x_1'), ylabel('x_2'), zlabel('y_1')
grid on, view(45,45)

hold on
plot(sf)
Warning: Start point not provided, choosing random start point.
> In curvefit.attention.Warning/throw (line 30)
  In fit>iFit (line 299)
  In fit (line 108)
     General model:
     sf(x1,x2) = a00 + a10*x1 + a01*x2 +a11*x1*x2
     Coefficients:
       a00 =    0.006328
       a01 =   -0.004922
       a10 =   -0.002109
       a11 =    0.001641