In [1]:
%plot inline -w 740
Wizualizacja wielowymiarowych danych
(Visualizing Multivariate Data - MATLAB documentation)
„In this example, we’ll use the carbig dataset, a dataset that contains various measured variables for about 400 automobiles from the 1970’s and 1980’s. We’ll illustrate multivariate visualization using the values for fuel efficiency (in miles per gallon, MPG), acceleration (time from 0-60MPH in sec), engine displacement (in cubic inches), weight, and horsepower. We’ll use the number of cylinders to group observations.”
In [2]:
clear all       % usunięcie zmiennych z pamięci
close all       % zamknięcie okien graficznych
format compact  % wyświetlanie wyników bez dodatkowych pustych linii
Wczytanie danych
In [3]:
load carbig
X = [MPG,Acceleration,Displacement,Weight,Horsepower];
varNames = {'MPG'; 'Acceleration'; 'Displacement'; 'Weight'; 'Horsepower'};
In [4]:
disp('X:'),disp(X(1:6,:)),disp(' ')
disp('Size of X:'), disp(size(X)),disp(' ')
disp('Model:'),disp(Model(1:6,:)),disp(' ')
disp('Cylinders:'),disp(Cylinders(1:6,:)),disp(' ')
disp('Min max:'), disp([min(Cylinders), max(Cylinders)])
X:
   1.0e+03 *
    0.0180    0.0120    0.3070    3.5040    0.1300
    0.0150    0.0115    0.3500    3.6930    0.1650
    0.0180    0.0110    0.3180    3.4360    0.1500
    0.0160    0.0120    0.3040    3.4330    0.1500
    0.0170    0.0105    0.3020    3.4490    0.1400
    0.0150    0.0100    0.4290    4.3410    0.1980

Size of X:
   406     5

Model:
chevrolet chevelle malibu
buick skylark 320
plymouth satellite
amc rebel sst
ford torino
ford galaxie 500

Cylinders:
     8
     8
     8
     8
     8
     8

Min max:
     3     8
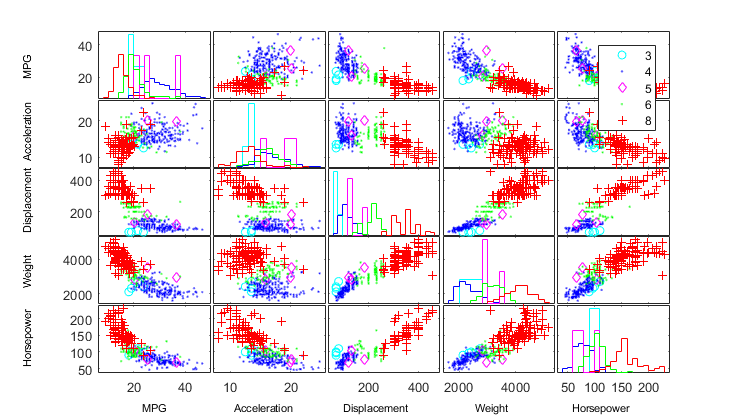
Wykresy rozrzutu
In [5]:
figure
plt=gplotmatrix(X,[],Cylinders,['c' 'b' 'm' 'g' 'r'],['o.d.+'],[],'on');
text([.08 .24 .43 .66 .83], repmat(-.1,1,5), varNames, 'FontSize',8);
text(repmat(-.12,1,5), [.86 .62 .41 .25 .02], varNames, 'FontSize',8, 'Rotation',90);
%set(plt,{'markers'},{12;5;9;9;9})
h = findobj(plt,'Tag','legend');
set(h, 'String', {'3', '4', '5', '6', '8'}, 'position',[.87 .8 0.06 0.16])
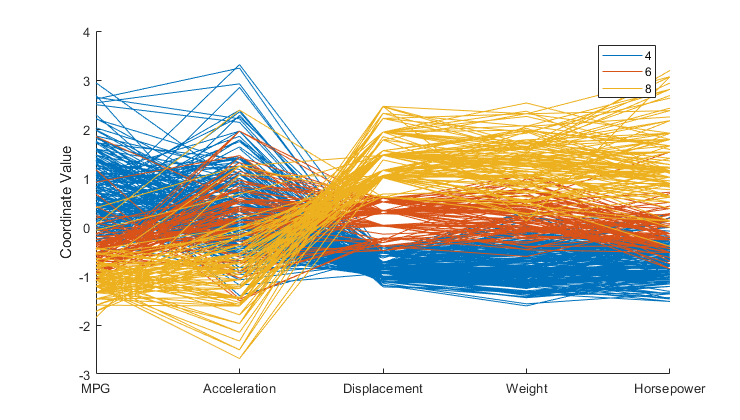
Wykres współrzędnych równoległych
(parallel coordinates plot)
In [6]:
Cyl468 = ismember(Cylinders,[4 6 8]);
parallelcoords(X(Cyl468,:), 'group',Cylinders(Cyl468), ...      %wartości na osi pionowej są ustandaryzowane
               'standardize','on', 'labels',varNames)           %każda zmienna ma wartość średnią 0 i wariancję 1
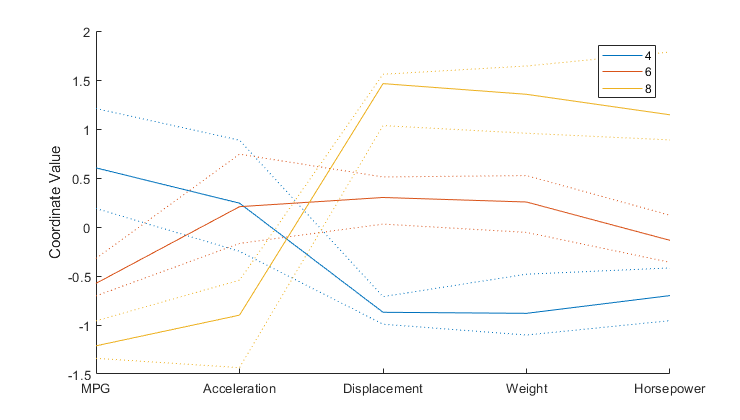
In [7]:
parallelcoords(X(Cyl468,:), 'group',Cylinders(Cyl468), ...
               'standardize','on', 'labels',varNames, 'quantile',.25)
Wykres glifów
(glyph plot)
In [8]:
h = glyphplot(X(1:9,:), 'glyph','star', 'varLabels',varNames, 'obslabels',Model(1:9,:));
set(h(:,3),'FontSize',8);
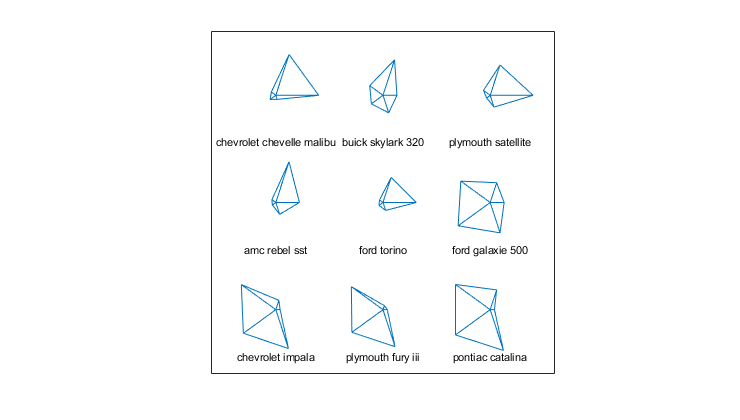
A star plot represents each observation as a “star” whose i-th spoke is proportional in length to the i-th coordinate of that observation
In [9]:
h = glyphplot(X(1:9,:), 'glyph','face', 'varLabels',varNames, 'obslabels',Model(1:9,:));
set(h(:,3),'FontSize',8);
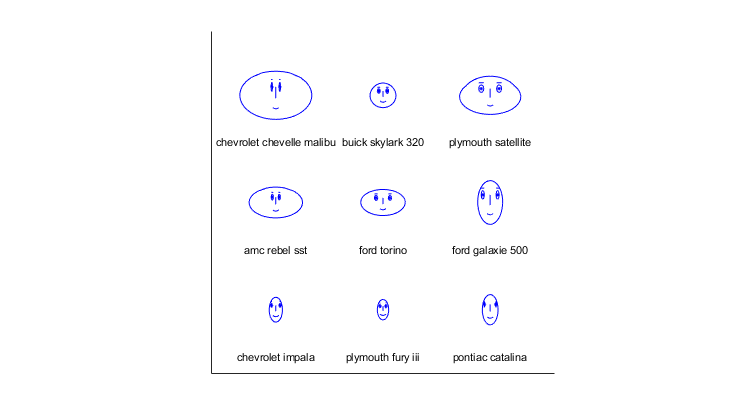
Column Facial Feature:
| No. | Feature | Parameter |
|---|---|---|
| 1 | Size of face | «MPG» |
| 2 | Forehead/jaw relative arc length | «Acceleration» |
| 3 | Shape of forehead | «Displacement» |
| 4 | Shape of jaw | «Weight» |
| 5 | Width between eyes | «Horsepower» |
| 6 | Vertical position of eyes |
In [10]:
models77 = find((Model_Year==77))
models77 =
   224
   225
   226
   227
   228
   229
   230
   231
   232
   233
   234
   235
   236
   237
   238
   239
   240
   241
   242
   243
   244
   245
   246
   247
   248
   249
   250
   251
In [11]:
s=size(models77)
l=length(models77)
s =
    28     1
l =
    28
In [12]:
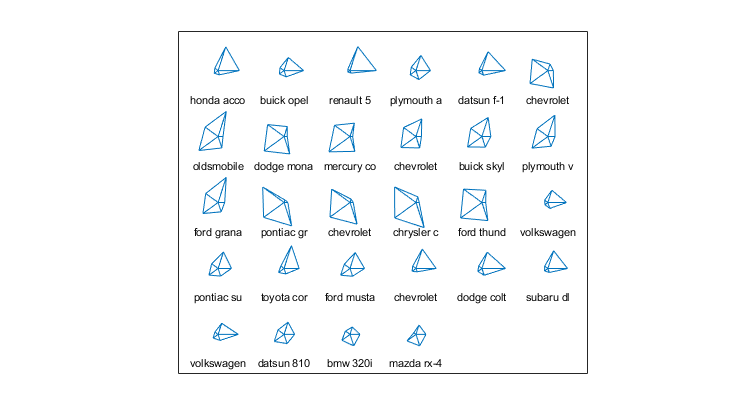
h = glyphplot(X(models77,:), 'glyph', 'star' , 'grid',[5 6], 'varLabels', varNames,...
'obslabels', Model(models77,1:10));
set(h(:,3),'FontSize',8);
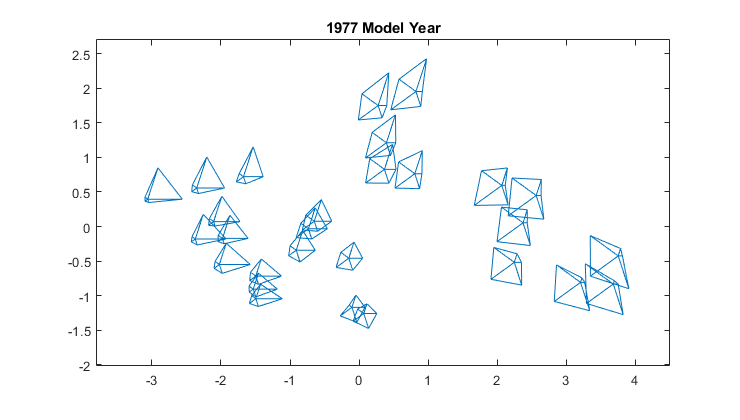
In [13]:
zs=zscore(X(models77,:));
dissimilarity = pdist(zs);
In [14]:
Y = mdscale(dissimilarity,2);
glyphplot(X(models77,:), 'glyph','star', 'centers',Y, ...
          'varLabels',varNames, 'obslabels',Model(models77,:), 'radius',.5);
title('1977 Model Year');